

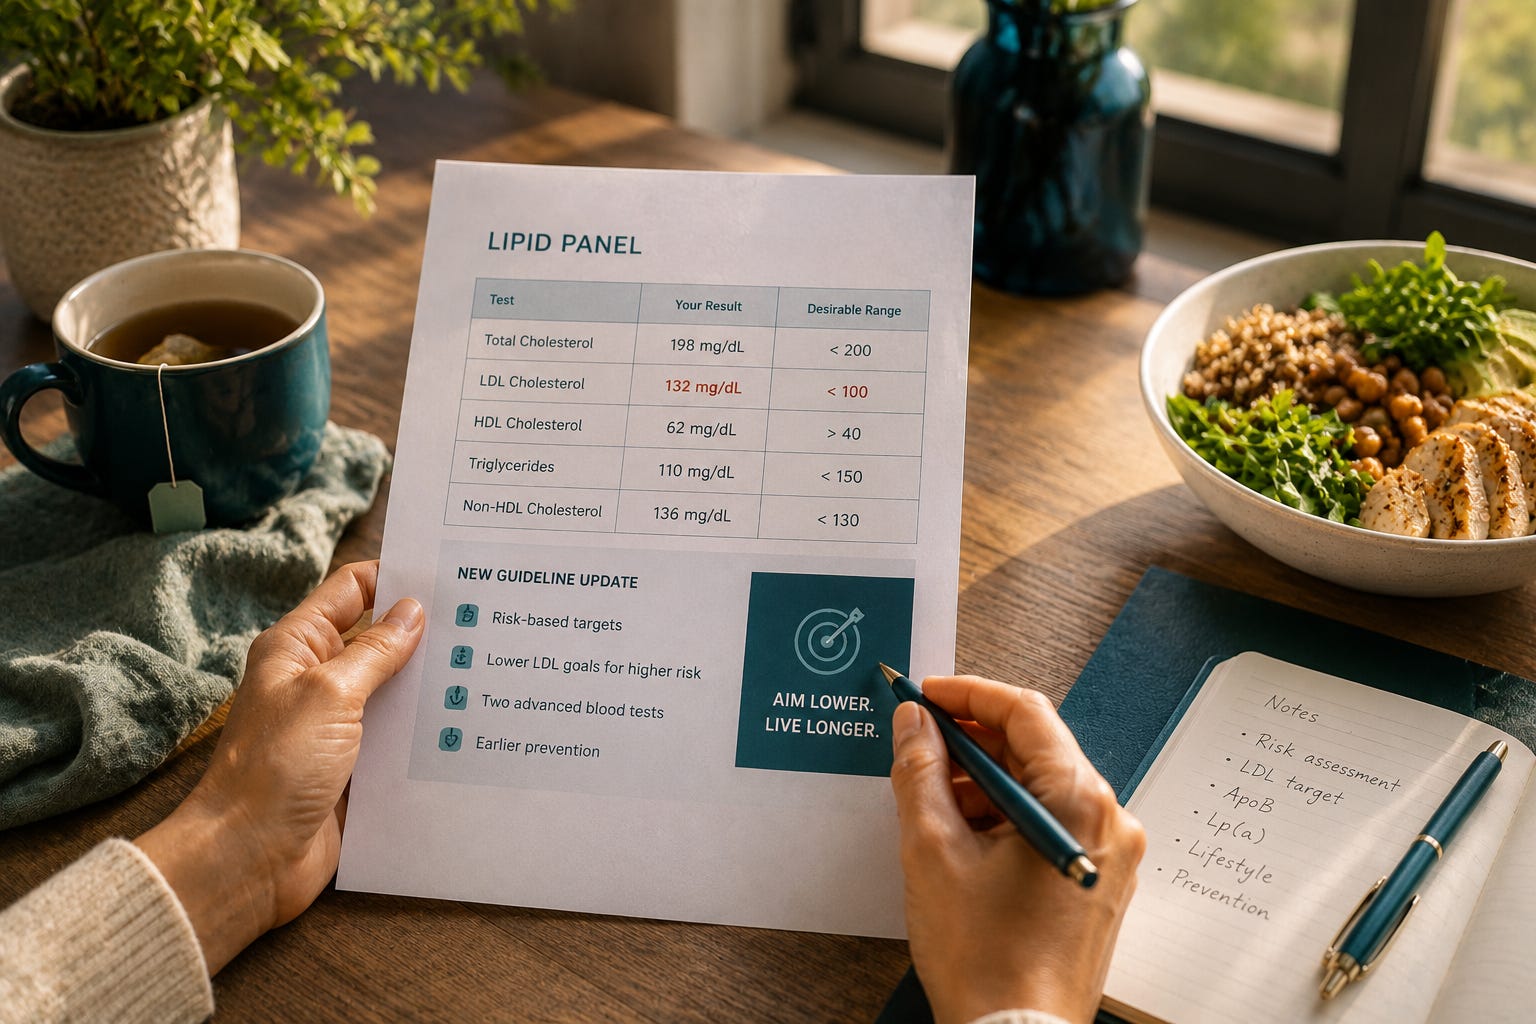
For eight years, the number on your cholesterol panel didn’t have a fixed target. The 2018 guidelines told doctors to lower LDL cholesterol, the low-density lipoprotein cholesterol that drives artery plaque, by a percentage and move on. Fifty percent lower than what, exactly, stopped mattering to a lot of people, because there was no line in the sand to point to.
That changed this year.
Eleven medical societies, including the American College of Cardiology and the American Heart Association, released a new joint guideline on dyslipidemia, the medical term for abnormal cholesterol, triglycerides, or other blood fats.¹ It replaces the 2018 guideline entirely, and it does something the old one didn’t: it gives you an actual number to aim for, based on your real risk, plus two new blood tests most people have never heard of.
If you’ve had a cholesterol panel come back “borderline” and been sent home with a shrug, this is the update that finally tells you what to do with that result.
Why Your Old Risk Calculator Was Probably Wrong
For over a decade, we’ve been using a formula called the Pooled Cohort Equations to estimate your 10-year risk of a heart attack or stroke. It was built from data collected between the 1960s and 1990s, mostly from a handful of study populations that don’t look like the country does today.
The new guideline replaces it with something called the PREVENT equations, developed by the American Heart Association using health data from more than 3.2 million people across 25 different studies, collected between 1992 and 2017.² Instead of estimating risk from a narrow set of old cohorts, PREVENT pulls from a population thirty times larger and far more representative of the people actually sitting in a doctor’s office today.
The new equations also do something the old ones couldn’t: they factor in kidney function, and they can estimate risk starting at age 30 instead of 40. If you’re in your early thirties and have been told you’re “too young to worry about this,” the guideline disagrees. Your risk can now be calculated a full decade earlier.
The inputs themselves are things your doctor already has on file: your age, sex, blood pressure, total cholesterol, HDL cholesterol, whether you have diabetes, whether you smoke, and how well your kidneys are filtering. If you have it available, your doctor can also factor in your average blood sugar over the past three months and even your zip code, since neighborhood-level data has been shown to carry real information about cardiovascular risk that individual factors alone miss.
Those numbers get entered into the PREVENT calculator, a free online tool built by the American Heart Association, and it outputs a percentage: your estimated risk of a cardiovascular event over the next 10 years, plus a 30-year estimate if you’re between 30 and 59. None of this requires a specialist visit. Bring the seven numbers above to your next checkup, or call ahead and ask your doctor to run your PREVENT score at the visit, and it’s a five-minute part of that conversation, using numbers that are likely already sitting in your chart.
Under the new system, your 10-year risk of a cardiovascular event falls into one of four categories:
Low: under 3%
Borderline: 3% to just under 5%
Intermediate: 5% to just under 10%
High: 10% or above
That’s the difference these categories are drawing, and I think it’s worth sitting with for a second. Picture 100 people who share your exact risk factors. At high risk, 10 or more of them will have a heart attack or stroke within the next decade. At low risk, fewer than 3 will.
That percentage is a calculation. Your doctor gets it from the numbers already in your chart, in the same conversation where the rest of this happens. Later in this piece I’ll walk through a coronary artery calcium score, a different tool entirely: an actual CT scan of your heart, used afterward, only for people whose risk percentage lands in that borderline or intermediate zone where the decision to start medication genuinely could go either way. Knowing your risk percentage comes first. The scan, if you ever need one, comes second.
The Targets Are Back, and They’re Lower Than Before
This is the headline change. The 2018 guideline asked your doctor to lower your LDL cholesterol by a percentage from wherever you started. No fixed destination, just a direction. The 2026 guideline throws that out and restores actual numeric targets, set by your calculated risk category rather than one number for everyone.¹
Not every pilot gets the same weather limit to take off. A small regional plane gets grounded at wind speeds a wide-body jet handles without a second thought, because the margin for error is different. Your LDL target works the same way. The number that counts as “safe” moves depending on how much is already stacked against your arteries, and the guideline spells out exactly how far it moves and why.
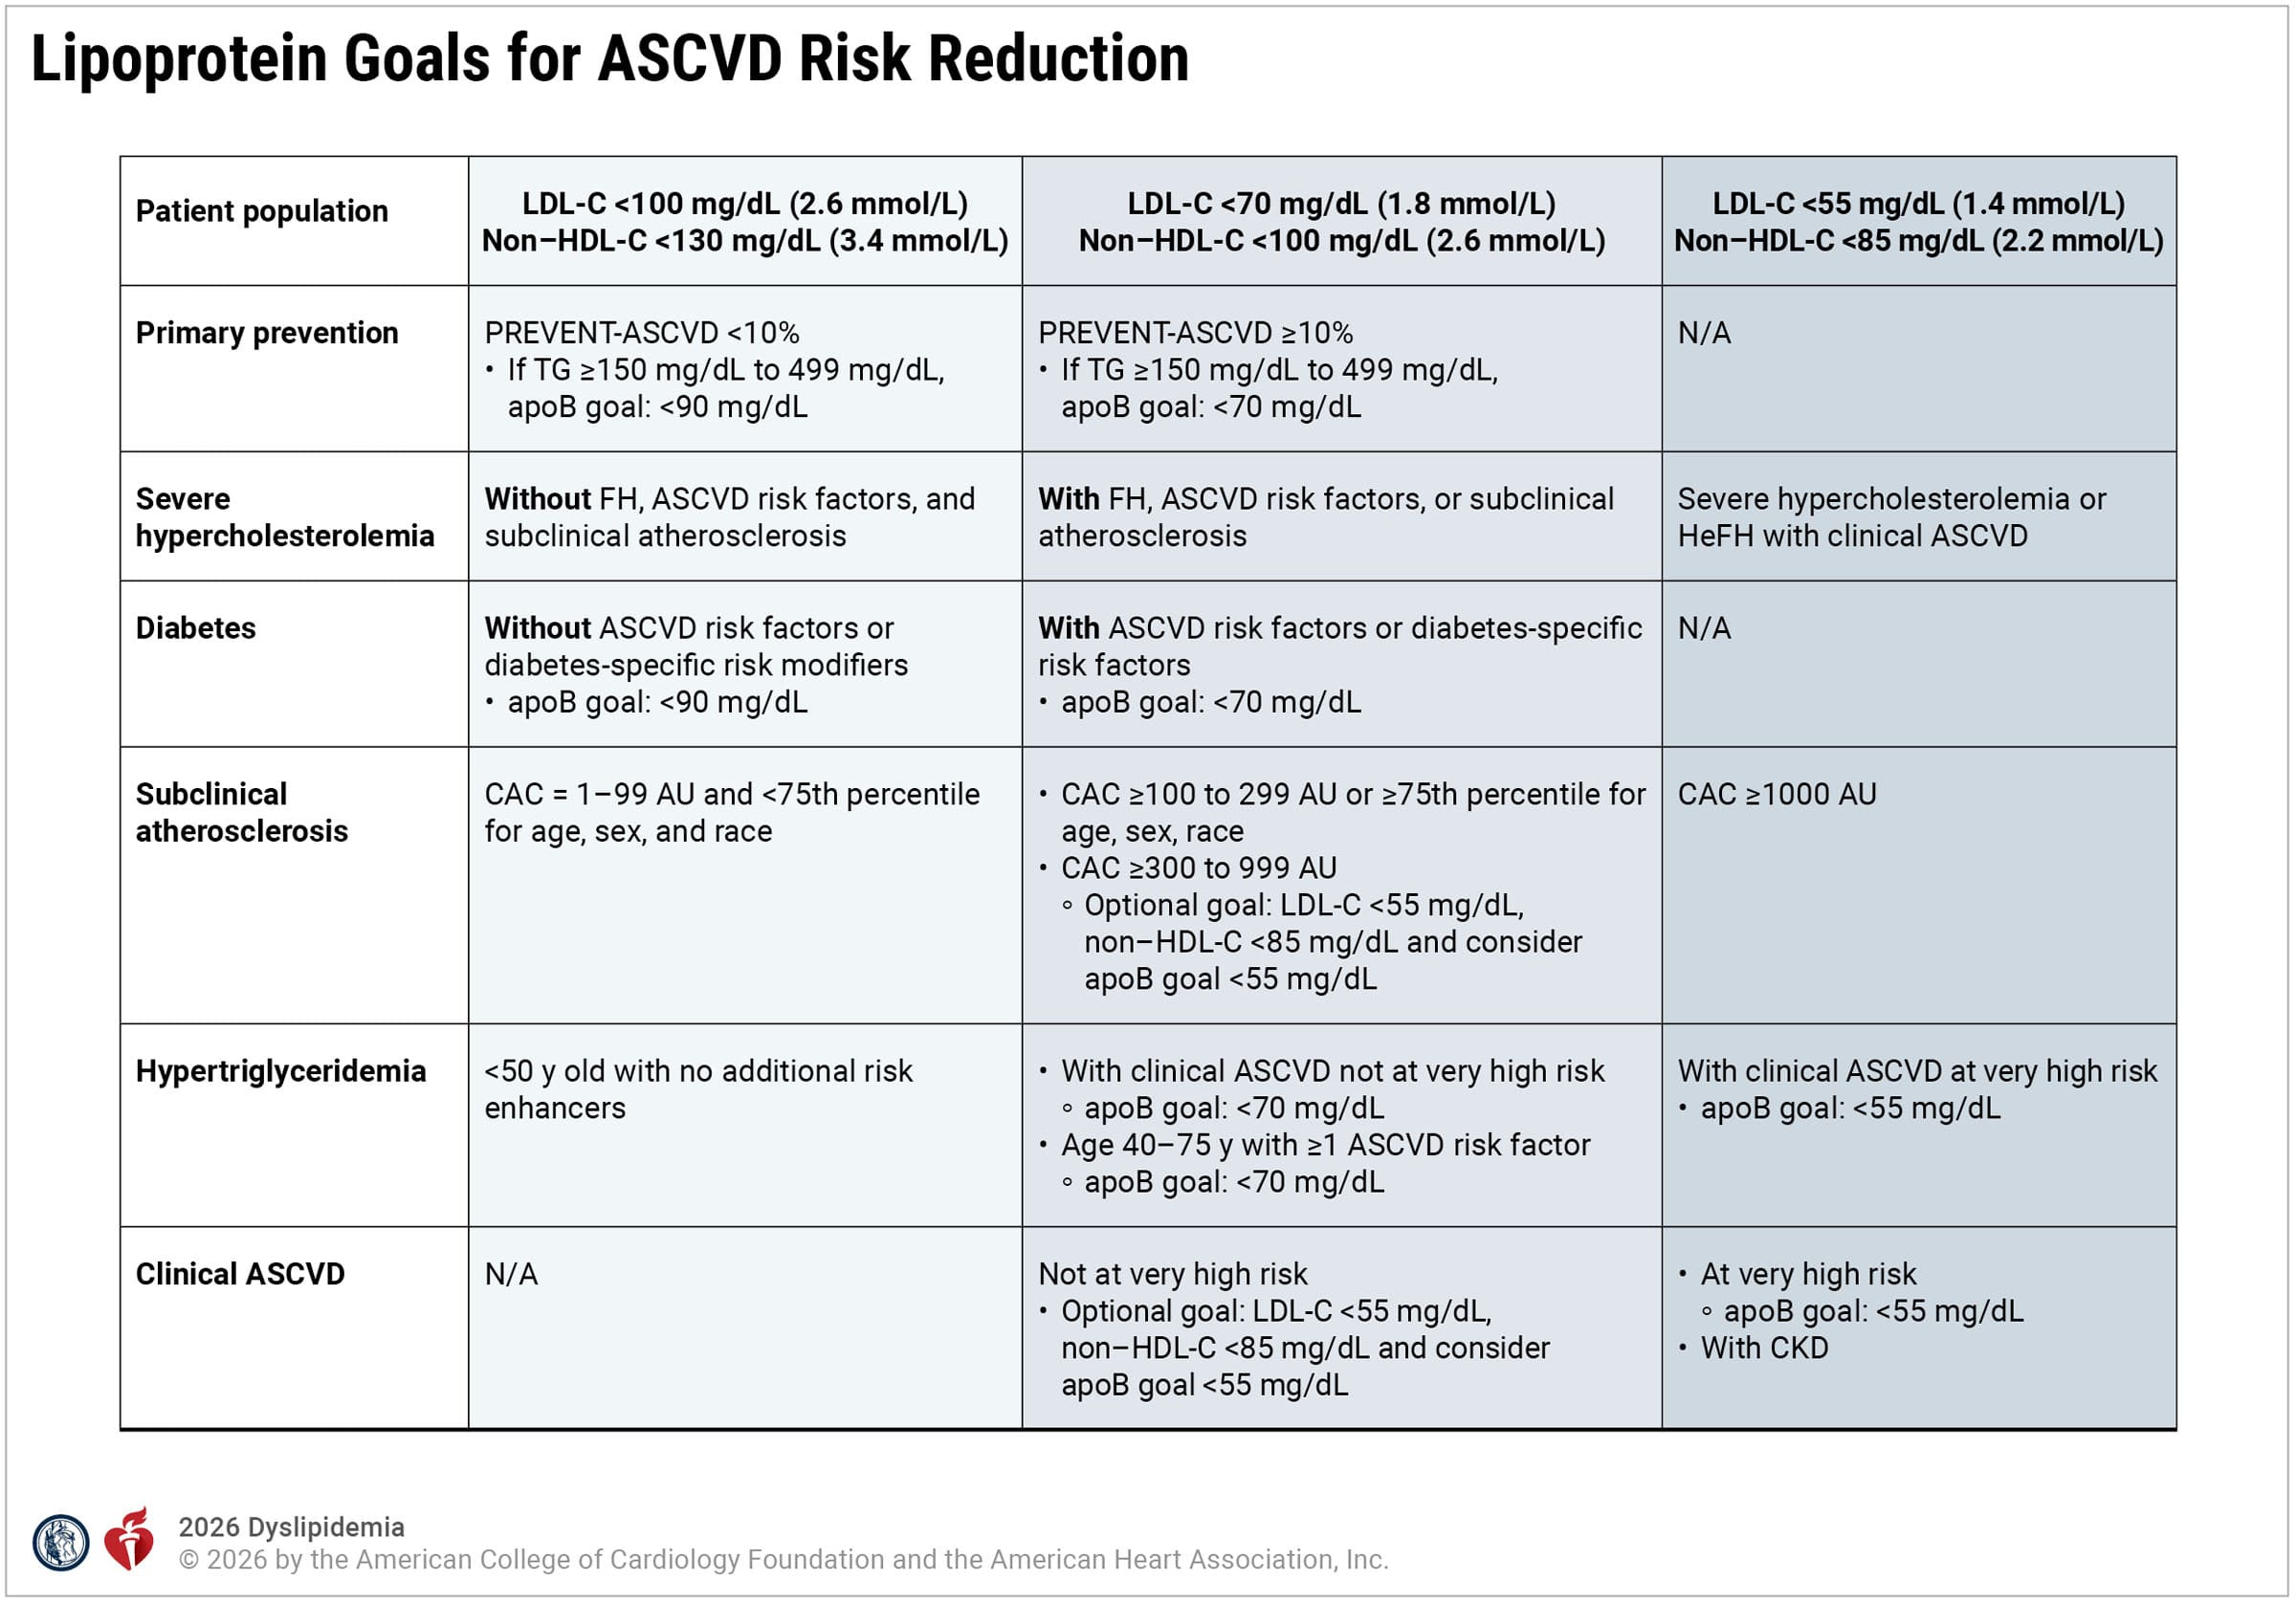
This is what it says, in plain language.
Your 10-year risk is the percentage from the calculation covered above, your estimated chance of a heart attack or stroke over the next decade. The guideline uses that percentage, plus your health history, to sort you into one of six situations, and each situation comes with its own target for LDL, the main number your doctor tracks. Most of the time, you only need to know that one number. Two more numbers, non-HDL and apoB, ride alongside it as backup checks, and you’ll only need those if your triglycerides are high or your doctor wants a second opinion on your risk. Start with LDL. Layer in the rest only if it applies to you.
If you have no history of heart or artery disease and your 10-year risk is under 10%, your LDL target is under 100 mg/dL. That’s the base case, and it covers most healthy adults without a heart condition. Push that same risk estimate to 10% or higher, and the target drops to under 70.
Three other situations tighten those same two numbers in a similar way.
Severe high cholesterol, meaning an LDL of 190 mg/dL or above, starts at the under-100 target if there’s no genetic cause, no other risk factors, and no visible plaque, but drops to under 70 if any of those are present, and under 55 if artery disease has already developed on top of that.
Diabetes works the same way: under 100 with no added heart risk factors, under 70 if there are added risk factors or complications like kidney or nerve involvement.
A coronary calcium scan, covered in the next section, follows the identical pattern in reverse: the more plaque it finds, the lower your target drops, from under 100 down to under 55 at the high end.
The last two situations carry the strictest numbers in the whole guideline.
High triglycerides with existing artery disease push the target down to under 70, or under 55 if that artery disease is classified as very high risk.
Anyone who’s already had a heart attack, stroke, or artery disease is held to under 70 at minimum, dropping to under 55 if they’re at the highest risk of a repeat event or have chronic kidney disease.
“Very high risk” isn’t a judgment call your doctor makes on a feeling. The guideline defines it with an actual checklist.
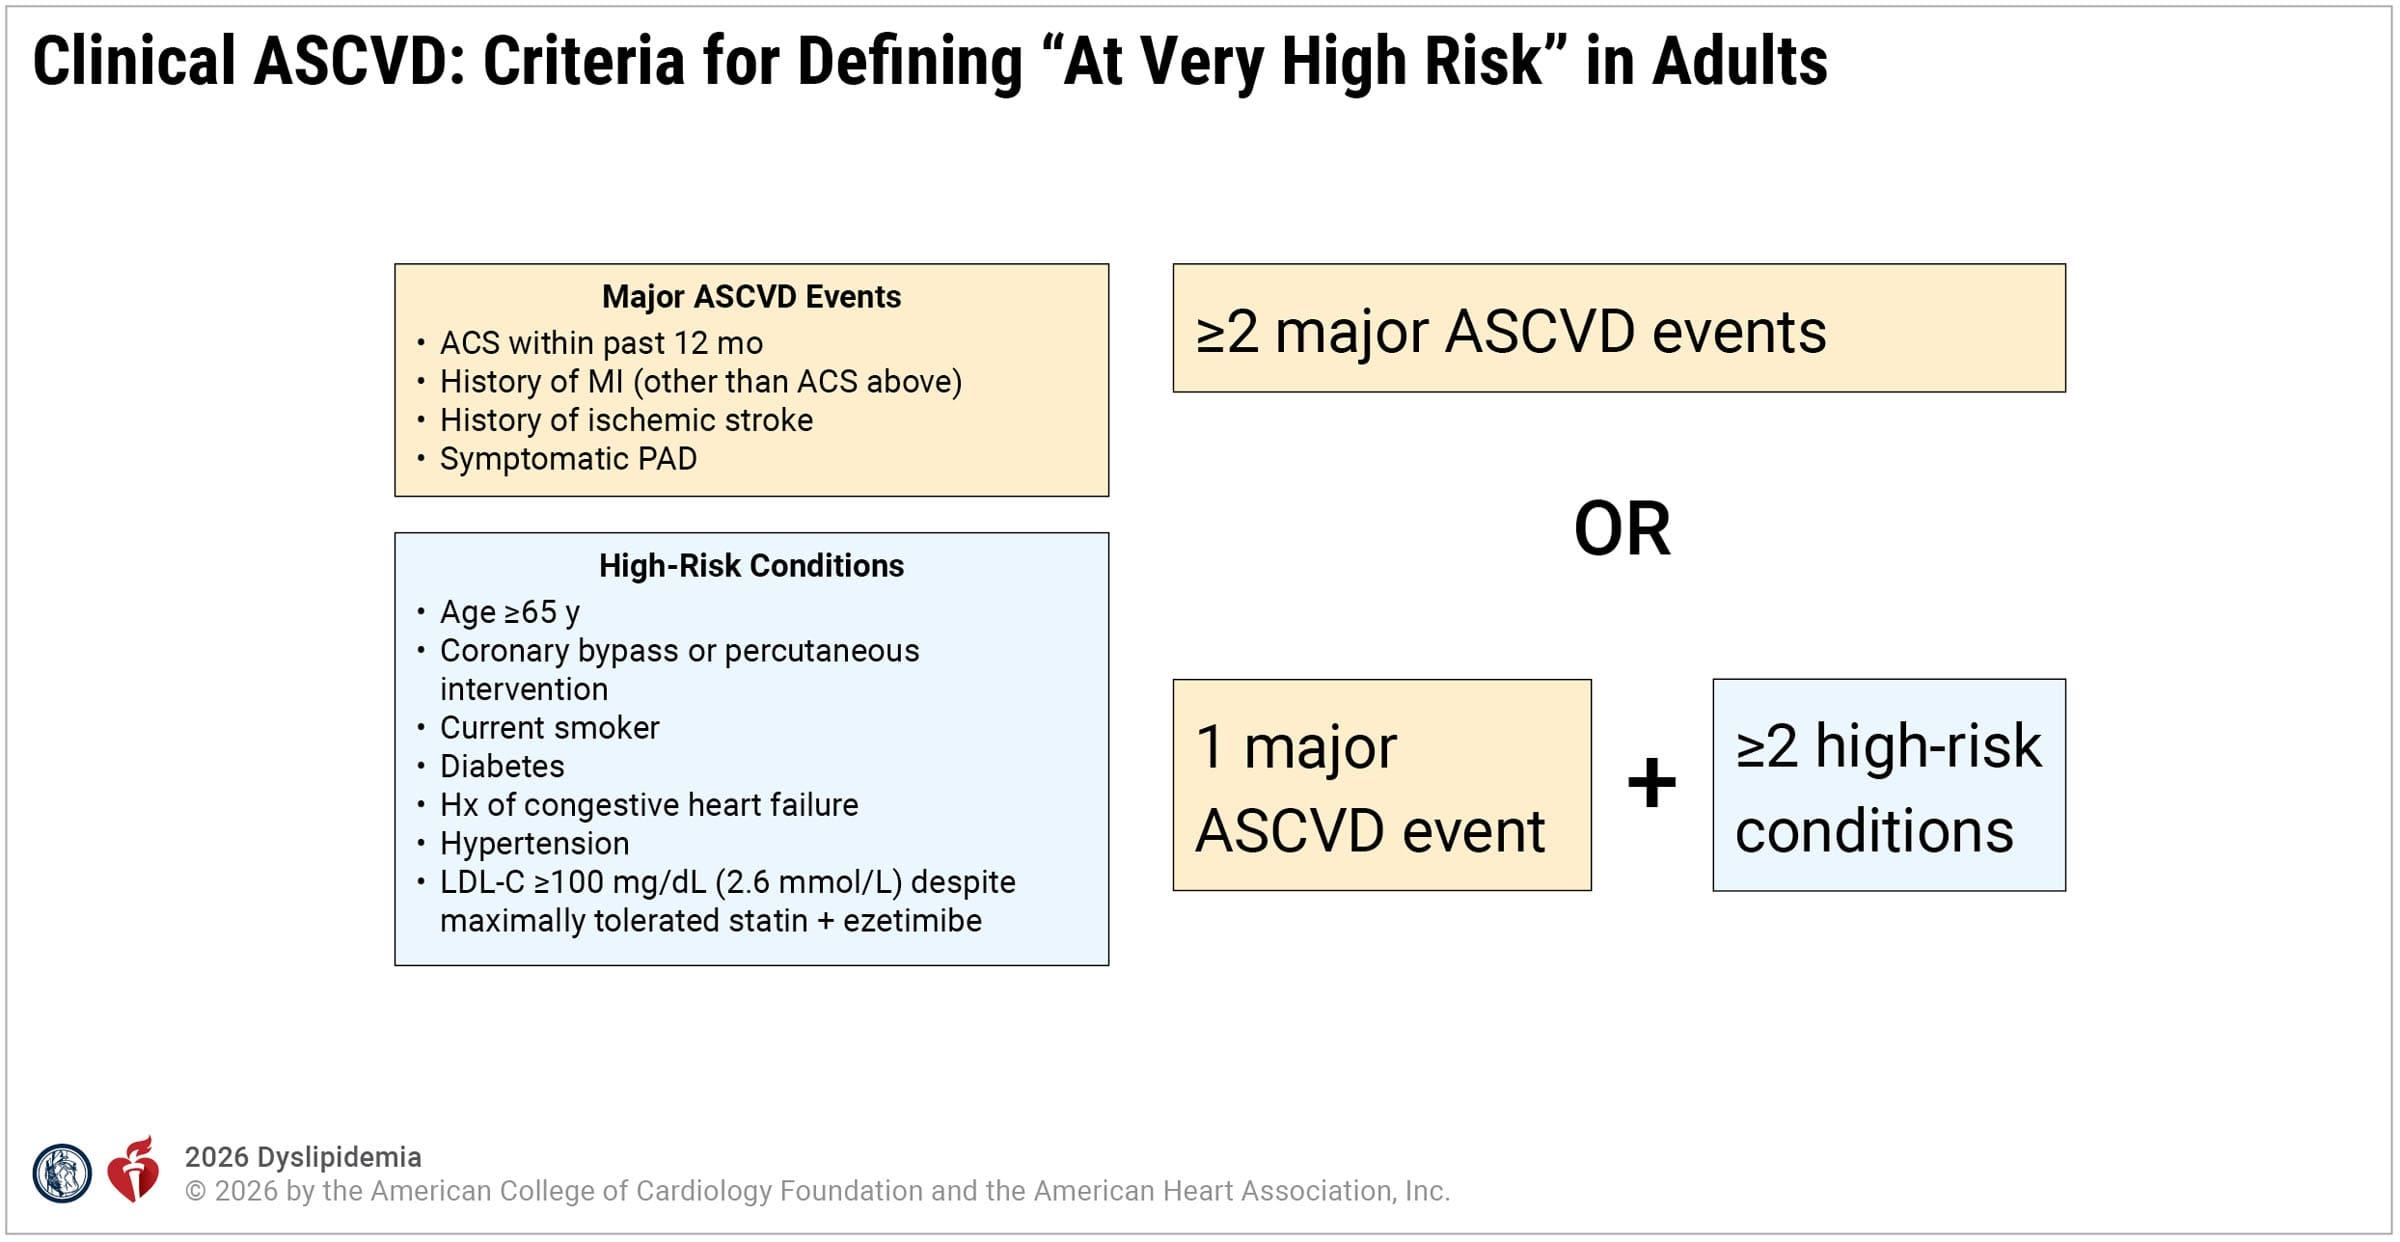
One side of that checklist is major cardiovascular events: acute coronary syndrome, a sudden drop in blood flow to the heart serious enough to require emergency treatment, within the past 12 months; a prior heart attack, medically called a myocardial infarction, at any other time; a prior ischemic stroke, where a blocked artery cut off blood flow to part of the brain; or symptomatic peripheral artery disease, narrowed arteries in the legs or arms severe enough to cause pain or other symptoms.
The other side is a list of high-risk conditions: being 65 or older, having had bypass surgery or a stent placed in a coronary artery, currently smoking, having diabetes, a history of congestive heart failure, high blood pressure, or an LDL that’s still 100 mg/dL or higher despite being on the maximum statin dose you can tolerate plus ezetimibe.
You land in the very-high-risk category, and the under-55 target, if you have two or more of the major events, or if you have just one event plus two or more of the high-risk conditions.
Now the two backup numbers.
Non-HDL cholesterol is your total cholesterol minus your HDL, the protective kind. It always sits a bit higher than your LDL target, since it captures a few more artery-clogging particles that LDL alone misses, and your doctor may track it alongside LDL rather than instead of it.
ApoB is more specific still: it only enters the conversation if your triglycerides run between 150 and 499 mg/dL, and it comes with its own target that mirrors your LDL number, roughly under 90, 70, or 55 depending on which category you land in.
Most standard lab reports flag LDL as high only when it crosses 130 mg/dL. The strictest target in this guideline is under 55. That's less than half of where a lab printout would even raise a flag.
All eight situations and every target above are laid out in full in the downloadable worksheet at the end of this post, along with space to write in your own numbers before your next appointment.
Where the Coronary Artery Calcium Score Fits In
Sometimes your risk percentage alone doesn’t settle the question of whether you need medication. This is where a coronary artery calcium score, or CAC score, comes in, as a follow-up test, not a replacement for the percentage you already calculated.
A CAC score comes from a specialized computed tomography scan, or CT scan, of your heart that directly counts calcium deposits in your artery walls, essentially photographing the plaque itself rather than estimating your risk of having it.¹ It’s most useful for people in the borderline or intermediate risk categories, where the decision to start medication genuinely could go either way.
A CAC score of zero is reassuring. Among people in that borderline or intermediate group, a score of zero means very few will have a cardiovascular event over the next decade, and the guideline says it’s reasonable to hold off on medication and simply recheck the score in three to seven years.¹ A score of 100 or higher tells a different story: people with that result have roughly the same 10-year event rate as someone already classified as high risk, and starting a statin is recommended.¹
This test doesn’t apply to everyone. It’s specifically for men 40 and older and women 45 and older who fall into that borderline or intermediate zone and want a tiebreaker before starting a medication they’d otherwise be uncertain about.
The Blood Test You’ve Probably Never Had
Buried in this guideline is a recommendation that’s a genuine first: every adult should have their lipoprotein(a) measured at least once in their life.¹
Lipoprotein(a), or Lp(a), is a cholesterol particle that behaves like a more dangerous cousin of LDL. It’s stickier, it promotes clotting, and it can accelerate plaque buildup in your arteries. The key difference from LDL is that Lp(a) is almost entirely set by your genes, inherited the way eye color is, and it stays roughly the same throughout your life.³ That means you only need to check it once, ever, unless you start a medication specifically designed to lower it.
An Lp(a) above 50 mg/dL is considered high enough to change how aggressively your other risk factors should be managed.¹ An estimated 1 in 5 people worldwide carries an elevated level, most without knowing it, because standard cholesterol panels don’t include this test unless you ask for it or your doctor orders it separately.³
Statins, the most common cholesterol medication, do essentially nothing to lower Lp(a).³ So if your LDL looks fine and you exercise and eat well, a high Lp(a) is still sitting there, untouched by the usual tools. No pill today reliably fixes the number. What the guideline says to do instead is treat it as a reason to be stricter about everything you can move: your LDL, your blood pressure, your weight. The logic is simple, your margin for error is narrower than someone with the same LDL and a normal Lp(a), so the other numbers have to work harder.
Nobody flagged this test before because it wasn’t standard until this year, which means you’re reading this at exactly the right moment.
The Second New Test: ApoB
The guideline also expands the role of a test called apolipoprotein B, or apoB. Every artery-clogging particle in your blood, including LDL, carries exactly one molecule of apoB on its surface. That makes apoB a direct headcount of how many dangerous particles are circulating, rather than an estimate based on how much cholesterol those particles happen to be carrying.¹
Most of the time, LDL and apoB tell the same story. But if your triglycerides run high, LDL cholesterol can look deceptively normal while the actual particle count, measured by apoB, is elevated.⁴ Research comparing the two in people already on statins found that apoB predicted future cardiovascular events more accurately than LDL cholesterol did whenever the two measurements disagreed.⁴
The guideline now recommends apoB testing specifically for people with elevated triglycerides, diabetes, or existing artery disease, precisely the situations where LDL alone can understate the real picture.¹
What’s Coming Up
You now know how your risk gets calculated, what your actual targets are, and about two blood tests that likely never came up in a routine visit.
In the paid section, you’ll get:
The specific lifestyle numbers, fiber, plant sterols, exercise, and weight loss, with the actual mg/dL and percentage effects behind each one, plus the more targeted dietary protocol the guideline specifies if your triglycerides are elevated
The full medication ladder the guideline recommends, in order, and when each next step gets added
What to actually do about a high Lp(a), including the medications now in trials and the one family conversation worth having
What it means when your LDL and apoB tell different stories, which one to trust, and exactly what changes about your treatment when that happens
Your own downloadable cholesterol targets and testing worksheet, so you can write in your numbers, compare them against your specific risk category, and walk into your next appointment with the exact questions to ask

These comments remind me why this newsletter exists. I want to thank all of you for being here, and for making this community the kind of place where real conversations about health actually happen.
